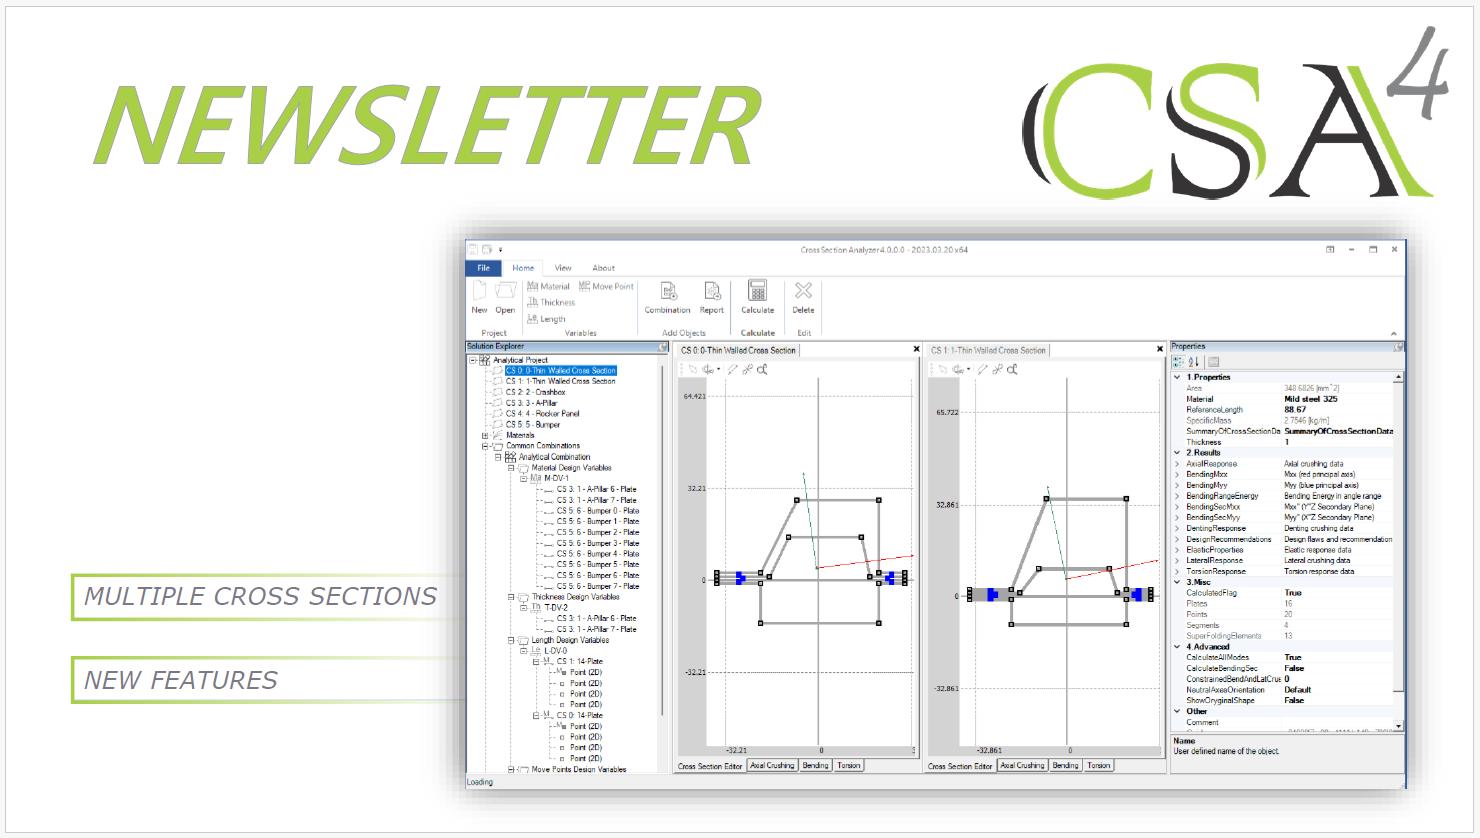
Cross Section Analyzer is a unique tool for semiautomatic optimization of beams’ cross sections. CSA gives you the possibility to automatically analyze hundreds of cross-sectional design concepts in seconds. Create your own analytical project examining various materials, thicknesses and geometries. During the automatic analysis procedure, the software will generate and calculate numerous design concepts based on your assumptions. Detailed and accurate results report, which you receive in an eye blink, enables you to easily filter cross sections in the search for an optimal design. You can set your optimization goal after calculating all possible solutions, and furthermore, change and modify it according to your needs. This fast and intuitive analyzer perfectly fits any pre-design or optimization routine speeding up the otherwise time and work-consuming tasks.
Cross Section Analyzer is a VCS extension designed to generate and analyze multiple cross-sectional variants, enabling design optimization to improve crash performance. It allows for the simultaneous creation, analysis, comparison, and filtering of results across various cross-sectional configurations, facilitating the identification of the variant that best meets performance criteria. Both newly created cross-sections and those used in existing VCS models can be optimized and analyzed. CSA also supports direct integration of the selected cross-sectional variant with the VCS model, enabling further analysis in both 2D and 3D according to the user’s needs.
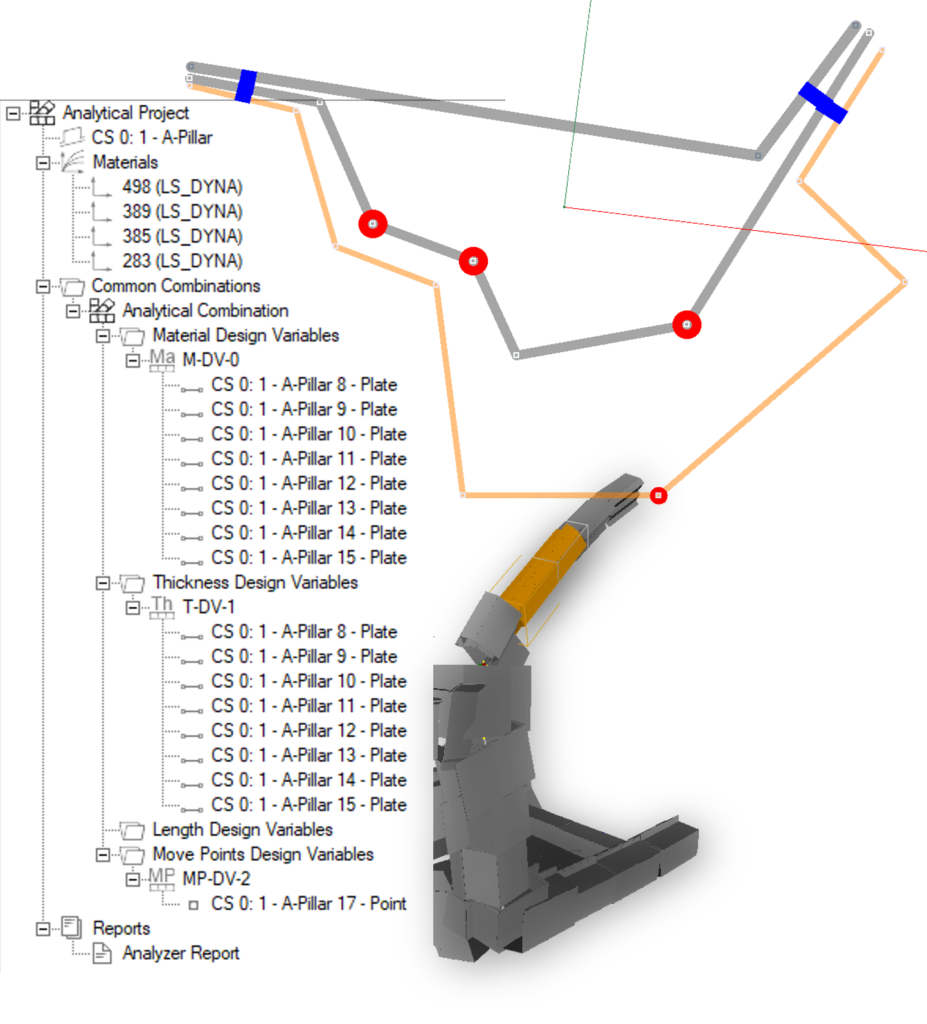
Objective: To develop an optimized A-pillar cross-section with improved crash performance, specifically enhancing energy absorption while reducing mass. Modifications are allowed only in the external segment (highlighted in orange), with changes in material, thickness, and cross-sectional geometry considered.
The CSA tool was employed for the analysis. Based on the project objectives, three design variables were defined: material, thickness, and point displacement.
For each design variable, the following parameters were considered:
material: 3 different materials
thickness: 4 thinner thicknesses with 0.2 mm increments
move point: the selected point displaced in 11 positions—5 in each direction with 2 mm increments from the reference position
 This resulted in 132 possible cross-section combinations, which were then calculated in the next step. The computation of these 132 cross-sections took less then 8 seconds, enabling further analysis and comparison of the resulting variants.
The number of analyzed variants was reduced by applying filters to limit specific mass and energy absorption parameters, thereby narrowing the pool from 132 variants to 7.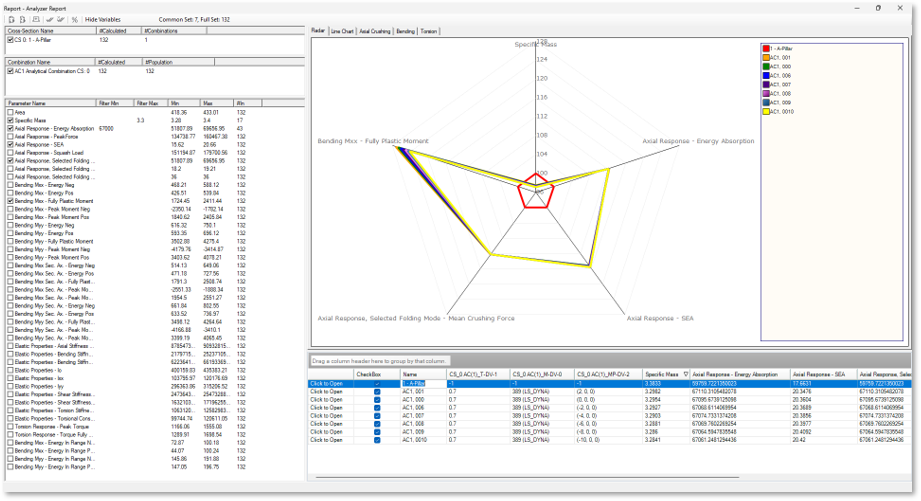 Upon closer inspection of the available variants, a consistent trend was observed across all variants meeting the filtering requirements, indicating material 389 and a segment thickness of 0.7 in several geometric configurations.
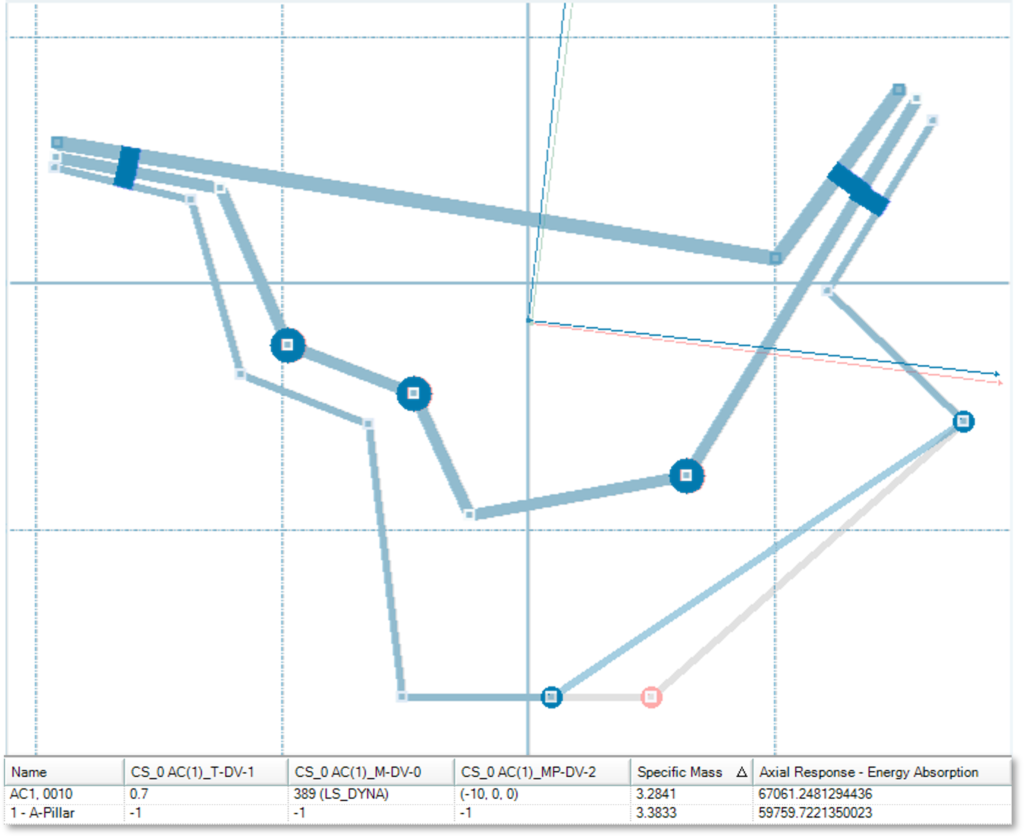
 With the available data, cross-sections can be conveniently compared using tools like radar charts. After sorting the variants by specific mass, the top variant featured a geometry where the reference point had been displaced by 10 mm. This cross-section, with the most favourable mass properties, is then selected.
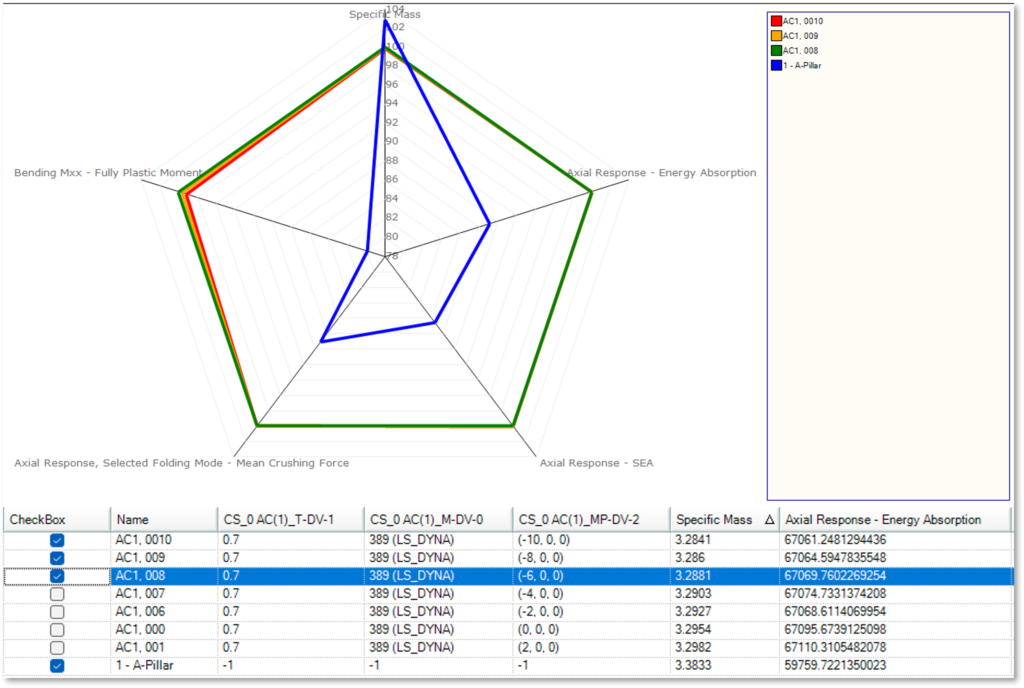 The following provides a comparison of the geometry and parameters between the reference cross-section and the optimized version obtained using CSA. This optimized cross-section can be further analyzed, documented in reports, or directly integrated into the VCS model for 3D analysis.
USE CASE EXAMPLE

Objective: To develop an optimized A-pillar cross-section with improved crash performance, specifically enhancing energy absorption while reducing mass. Modifications are allowed only in the external segment (highlighted in orange), with changes in material, thickness, and cross-sectional geometry considered.
The CSA tool was employed for the analysis. Based on the project objectives, three design variables were defined: material, thickness, and point displacement.
For each design variable, the following parameters were considered:
material: 3 different materials
thickness: 4 thinner thicknesses with 0.2 mm increments
move point: the selected point displaced in 11 positions—5 in each direction with 2 mm increments from the reference position

 This resulted in 132 possible cross-section combinations, which were then calculated in the next step. The computation of these 132 cross-sections took less then 8 seconds, enabling further analysis and comparison of the resulting variants.
The number of analyzed variants was reduced by applying filters to limit specific mass and energy absorption parameters, thereby narrowing the pool from 132 variants to 7.
 Upon closer inspection of the available variants, a consistent trend was observed across all variants meeting the filtering requirements, indicating material 389 and a segment thickness of 0.7 in several geometric configurations.
 With the available data, cross-sections can be conveniently compared using tools like radar charts. After sorting the variants by specific mass, the top variant featured a geometry where the reference point had been displaced by 10 mm. This cross-section, with the most favourable mass properties, is then selected.
 The following provides a comparison of the geometry and parameters between the reference cross-section and the optimized version obtained using CSA. This optimized cross-section can be further analyzed, documented in reports, or directly integrated into the VCS model for 3D analysis.

Please visit the (CSA – manual) section for detailed information about using Cross Section Analyzer.
Please visit (CSA – tutorial) section for additional training resources, use cases and tips on the capabilities of Cross Section Analyzer.
Please feel welcome to share with us all your comments and suggestions. We will try to meet your expectations in the future versions of CSA software.
Agata Abramowicz Sokoll- Impact Design Europe
contact: as@impactdesign.pl
